
Poor website performance can negatively affect your SEO, conversion rates, bounce rate and overall user experience, so making your website faster and keeping it fast should be your top priority. For many startups, their website is a very important growth engine, so you will want to keep yours running as smoothly as possible.
Making your website load 1 second faster can increase your conversion rate by up to 27%, according to Google. Cloudflare also gathered a few different examples showing the same pattern. You can use these numbers and do the math for your own website to see how much you could gain by making it faster, or how much you can lose if you allow the performance to degrade.
The crazy thing is that this might not even show up on your analytics if the users are abandoning the page before your analytics script manages to load.
On top of that, Google uses page speed as one of the ranking factors, so poor performance can also hurt your organic traffic as it can potentially make you show up lower on the search engine results page (SERP).
But don't let poor website performance scare you because we are about to cover why it happens, how to analyze it, how to optimize it and keep it optimized in the long run, as well as when to seek outside help.
Why Websites Perform Poorly
The reason for poor performance is very simple - the website isn't well optimized (we'll cover what this implies later in the article), but why does that actually happen? What is stopping all websites from being fast?
One issue with no-code website builders like Webflow is that they are visual, so you don't need a lot of technical knowledge but you still make the website look good. This can give people a false sense of security and make them think they are done as soon as the website is visually complete, but this pretty website can have a lot of hidden issues. As you'll see, Webflow has different tools built in that help you optimize your website, but you need to know how to use them.
Other common issues are short deadlines and limited budgets. If you ask someone to cut out as many things as they can from the project to get things done faster and/or bring the price down, performance optimization will be one likely candidate because a website can be functional even if it's not that fast.
Long Term Use
The list of issues extends to long term use, where more and more people in the company start working on the website, most of them not being developers and not possessing the technical knowledge. In this scenario, even if the website started off great, the performance can degrade over time.
One small change usually won't cause much of a difference, but they can add up over time and result in a very inefficient website.
Reality of Things
In business, corners often need to be cut, especially with early stage startups, so things like this are bound to happen. To be clear, having a slightly slower website won't hurt you that much if you are just starting out, but as you scale all the performance related issues will get amplified. Just like with your product, you can launch an "MVP" website, but you should invest in optimizing it as it starts getting traffic and make sure it stays optimized so it doesn't hinder your growth.
While some issues can be ignored if you just spend more money on marketing, it is much better to fix a leaky bucket before pouring more water into it. The same principle applies to website performance, so we'll now learn how to check if our bucket is leaky.
Assessing Performance
The first step in improving your website's performance is assessing where it currently stands. This will show you where to focus your efforts and it will set a baseline that you can compare against to see if the changes you made produced the right results.
Two tools I like to use for this are Google's PageSpeed Insights and Catchpoint's WebPageTest. We will cover how to use these tools and what each of them is good for. For now we will only focus on what these tools show you, we'll talk about how to actually address issues they detect in the next section of this article.
Additionally, these tools show a lot of info, and most of it includes links where you can learn more, so I will highlight the things you need to focus on. If you decide that you need to learn more, you will be able to find more info very easily right within the tools.
PageSpeed Insights
PageSpeed Insights is a pretty straightforward tool made by Google. To use it just paste in a link of the page you want to test, run the test and it will show Core Web Vitals and the test results. Core Web Vitals are also shown in the Google Search Console for your website and they can affect your SEO, so you will likely want to pay more attention to them than the test results.
You can use the tool to test any website that is available on the internet, so aside from testing your own website, you can also use it to see how well your competitors' websites are doing.
Core Web Vitals
The Core Web Vitals Assessment shows data from Chrome UX Report, a dataset reflecting how real world Chrome users experience websites. The number in PageSpeed reflect the data for past 28 days, the first three numbers being the actual Core Web Vitals and your aim should be to keep all of them green. The numbers below them are just other notable metrics and they aren't show in the Search Console but they can still come in useful.
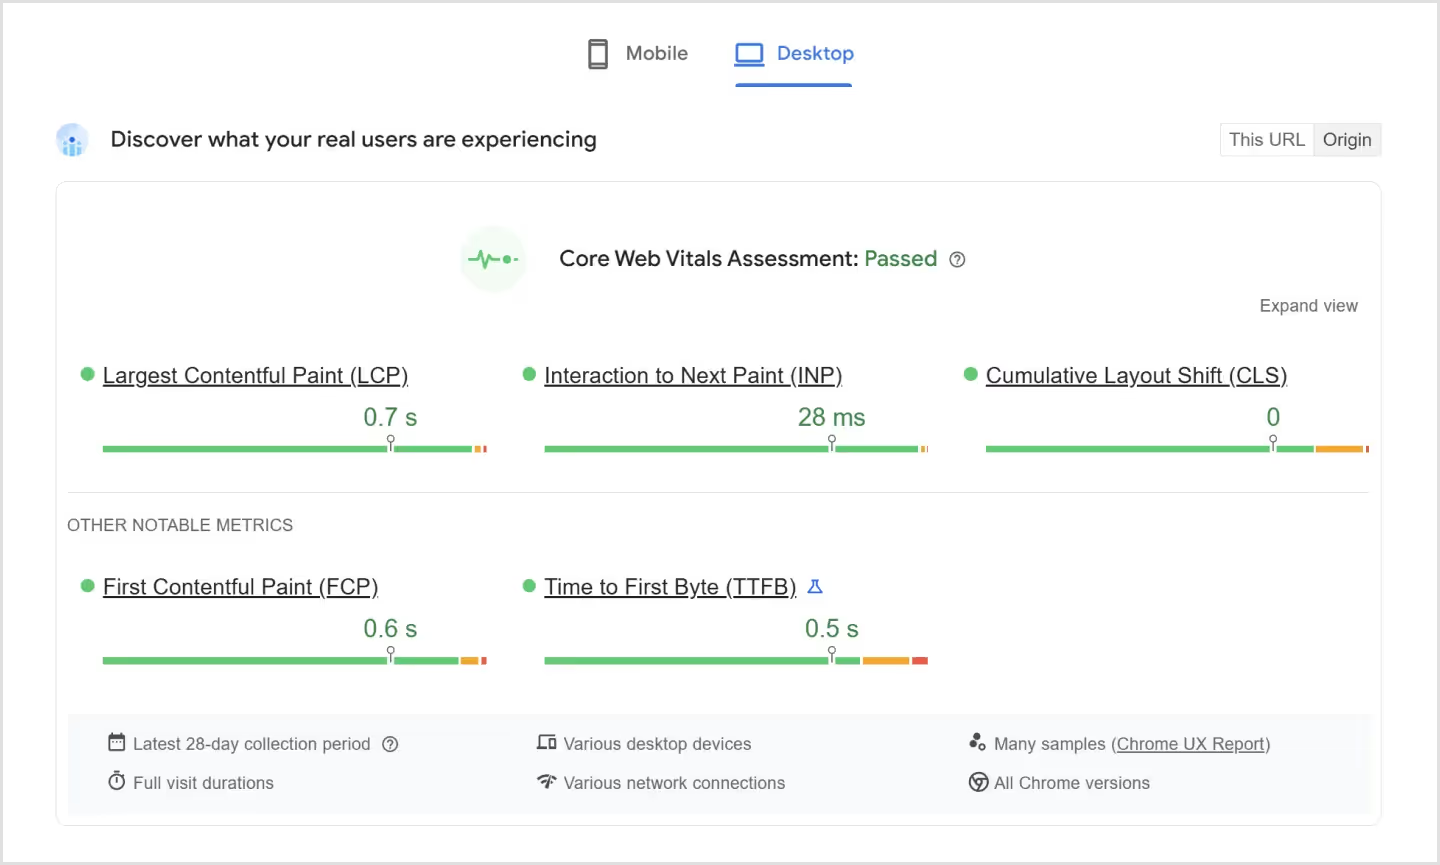
Since the numbers reflect real-world data over a longer period of time, I give them priority over test results that only shows what the tool detected this time you ran the test.
Core Web Vitals are collected and shown separately for Mobile and Desktop, and you can switch between them using the two tabs right below the text field where you added your URL. You can also switch between viewing the Vitals for the current page and for the whole website using the This URL / Origin toggle, provided that there is enough data for the page you are testing.

When there is not enough data for a certain device type, the Core Web Vitals won't be shown and instead you will get a small "No Data" message in the top-right. Same goes for the This URL toggle which may be disable if there is not enough data for the page you are testing. For example, my website mostly gets opened on desktop devices, which makes sense for a portfolio website, so there is no data for mobile but for desktop there is enough data for both the website as a whole and the homepage by itself.
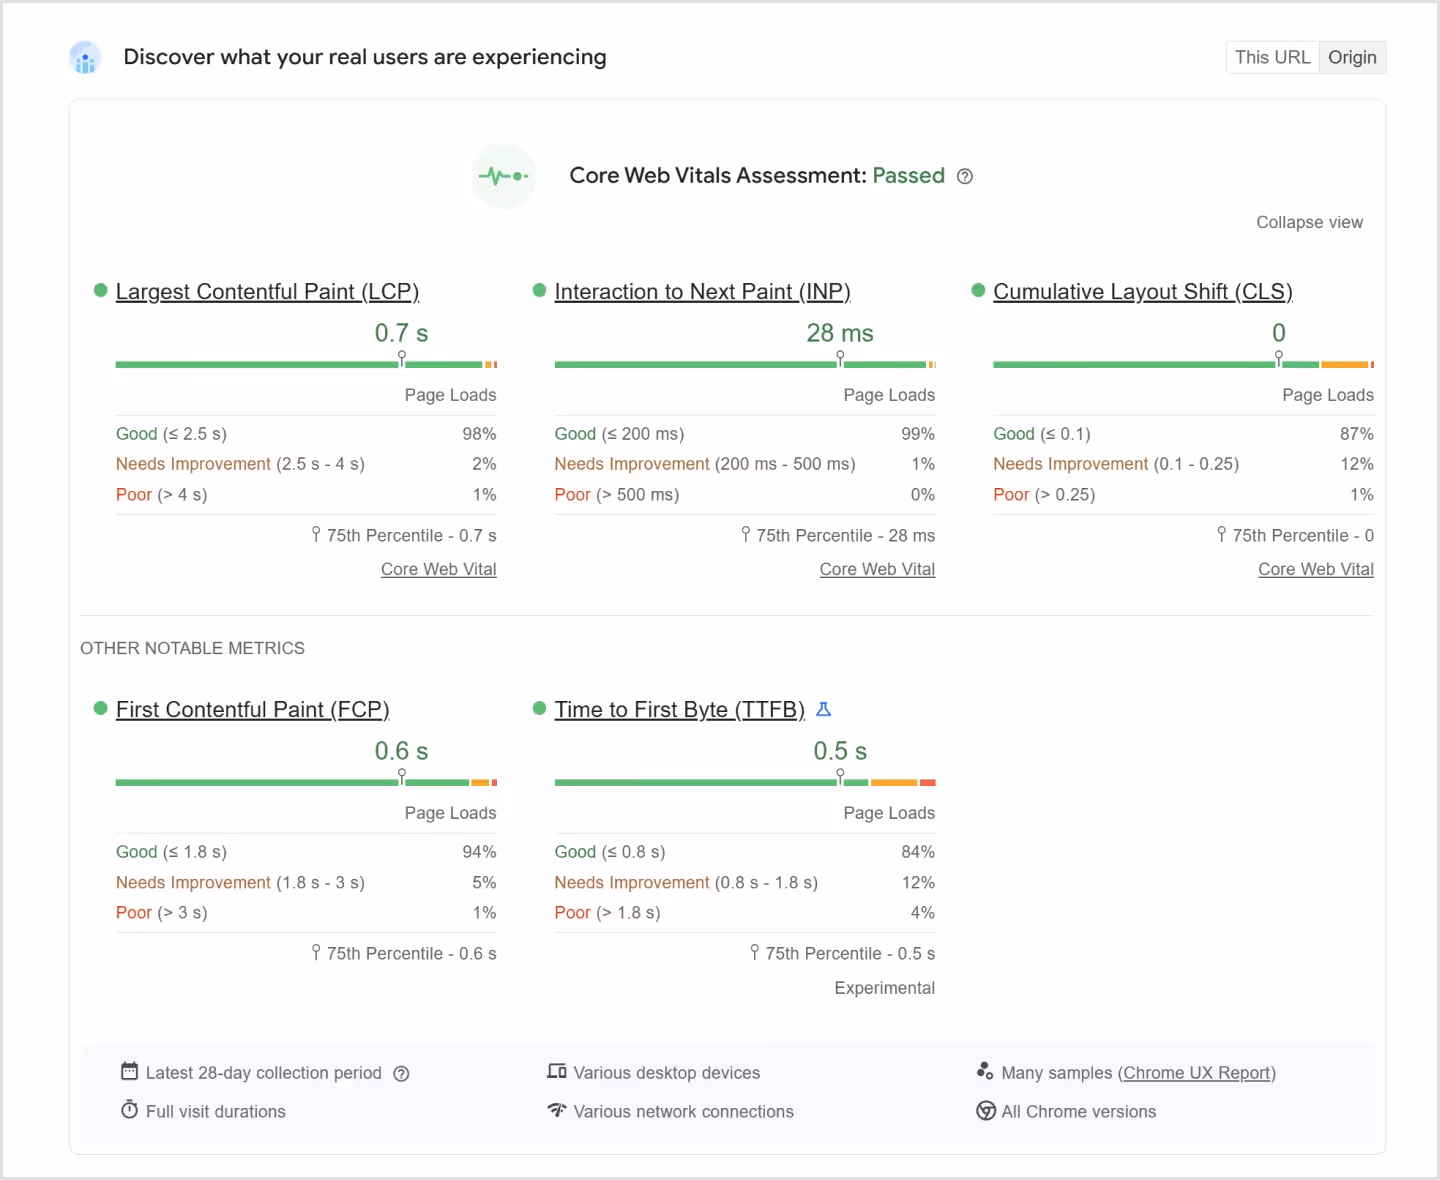
Another useful toggle is the "Expand view" which you can use to see a detailed breakdown for each metric, showing what percentage of users falls within each category - Good, Needs Improvement and Poor. Keep in mind that things like poor internet service can affect these metrics, so most websites will have at least 1% in the Poor category.
Test Results
Test results show you how your website performed during this run. but this can be a good thing as you can test to see if your changes produced results right away instead of having to wait 28 days to fully see their effect through Core Web Vitals.

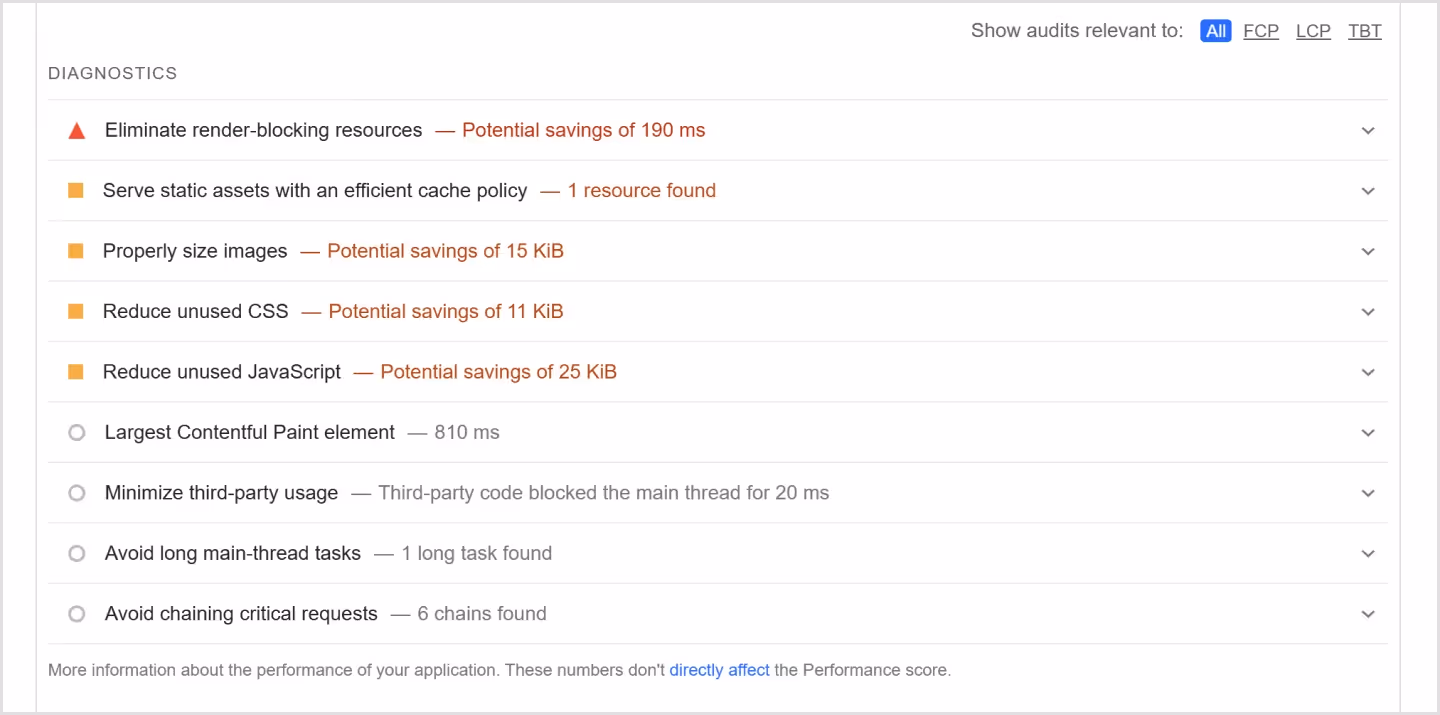
The results are displayed across four categories: Performance, Accessibility, Best Practices and SEO. The latter three don't really affect performance per se, but they can highlight issues that may be hurting your search performance or making your website noncompliant with accessibility standards. You should be able to hit a perfect 100 score with these three metrics pretty easily, and with Performance your aim should be to get it to 90+ because getting a perfect 100 isn't realistic for most websites.
Below the results overview, you will get a more detailed breakdown with specific issues and recommendations for each of the four categories. For the latter three these will likely be small technical issues, like low contrast between a piece of text and it's background, or not having a meta description for the page you are testing, and you should be able to fix these quite easily.
For Performance you will likely get more suggestions, some of which you won't be able to avoid with Webflow (or most other builders and frameworks), but they won't stop you from having excellent performance. Even the example of a test shown above with a Performance score of 100 had 5 different warnings, shown below.
WebPageTest
WebPageTest is another great tool that is a bit more advanced compared to PageSpeed. Running a test is still very simple, just paste in the link and click on "start test". There are some additional setting you can play with, but most often I leave them at default.
Same as with PageSpeed, it will give you a lot of performance metrics, and same as with PageSpeed, these might vary slightly from real world as they usually simulate a slower connection. I would still prioritize Core Web Vitals as the main metric you should monitor, but these test results can be very useful for diagnosing issues and comparing performance after you make a change.
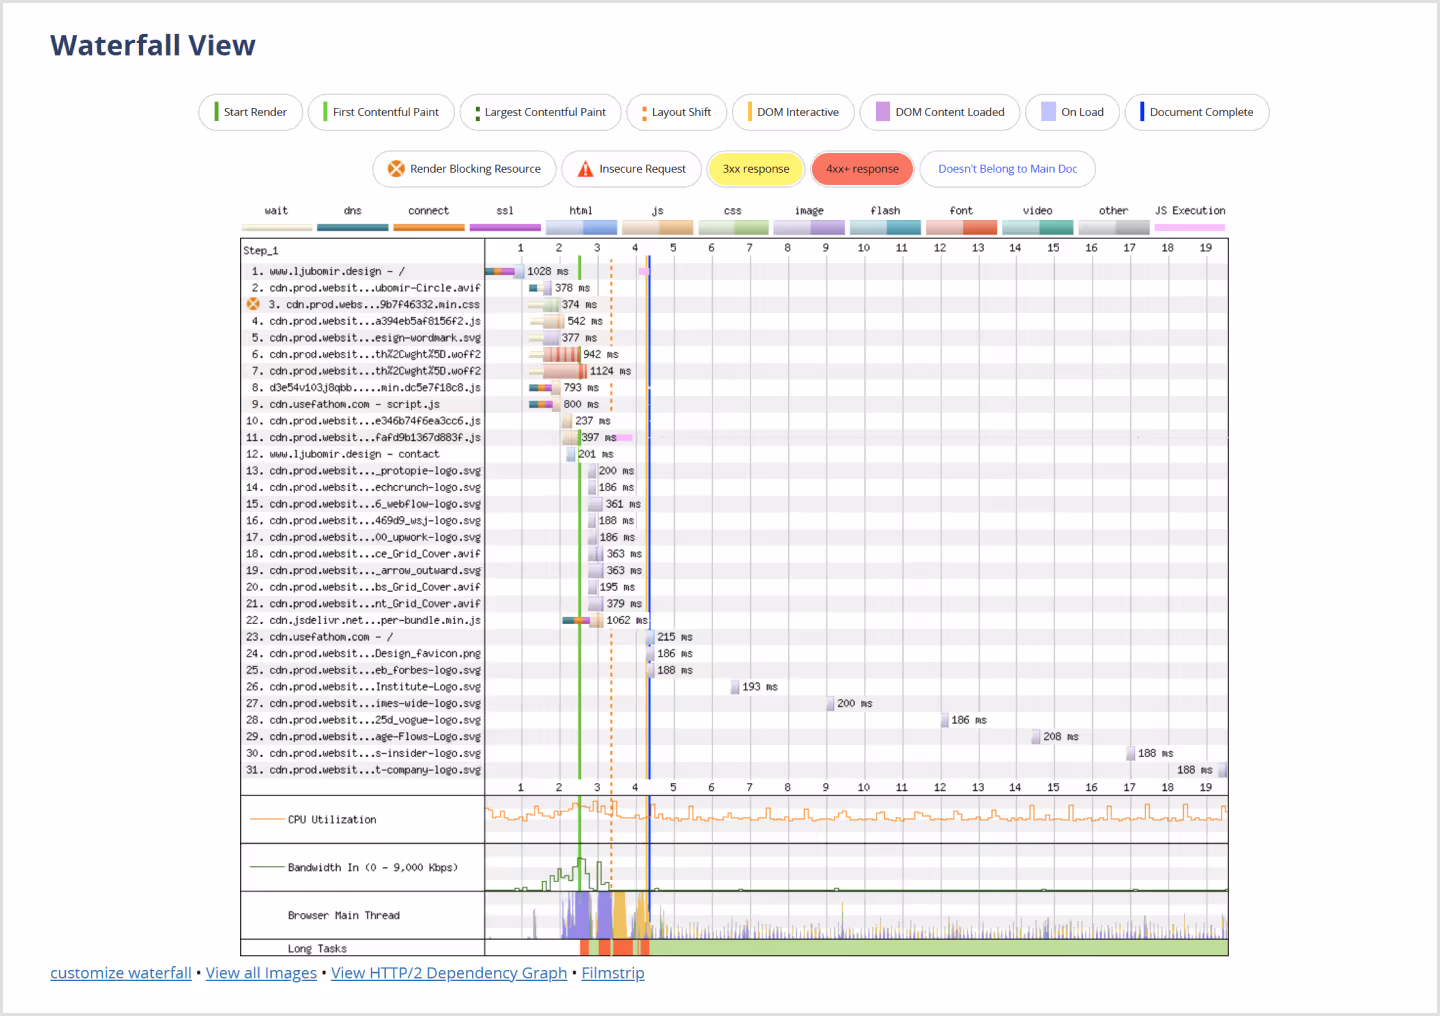
A lot of the same things can be done with PageSpeed, but one feature I come to WebPageTest for is waterfalls. There is a separate one for each of the 3 runs, and they show you requests and resources that are being loaded, as well as when important events, like Largest Contentful Paint, are happening. This feature will come in really handy once we start talking about some more advanced optimization tactics.
Optimizing Performance
Once you have determined what aspects of performance your website it's lacking in, it's time to start optimizing it. We will cover the usual suspects of poor website performance, but you don't necessarily need to invest time in doing all of them - provided that your Core Web Vitals are good, you might not need to optimize something, even if the speed test tools show some suggestion or error.
Get ready as it will get a bit technical. If it starts looking like too much for you, skip to the next section about maintaining performance, there we will discuss how to go about hiring someone to help you with your website's performance.
Optimizing Images
Images will likely be largest in file size out of all the resources on the page, so they carry the biggest potential for improving your website's performance. The two main factors that will dictate the file size of your images are resolution and file format.
Image Resolution

When it comes to resolution, Webflow automatically makes your images responsive, meaning it creates smaller versions of the image based on the full-res version you uploaded. However, for best results, you still want to avoid uploading images that are too large. Usually I like to look at what resolution the image will be displayed at on desktop and then export it at double that resolution (@2x) so it looks sharp on high resolutions screens. Webflow will take it from there and create additional versions for smaller screens.
Image Formats

When it comes to file format, for images you usually want to go with .avif or .webp, and once again Webflow has your back here as you can convert images into these formats right in Webflow by expanding the Assets panel, selecting the images you want and clicking the compress icon. WebP has slightly better browser support than AVIF, but AVIF files tend to be smaller. Neither of them are supported by Internet Explorer, but the file size difference compared to PNG and JPEG is definitely worth it, unless you somehow have a lot of visitors using a browser that was officially retired in 2022.
Another trick you could use to further reduce the file size is giving the image a solid background instead of leaving it transparent. This might not be applicable if the image will be overlapping other elements that need to be seen, but if it will be displayed over a solid background anyway you can make the file a bit smaller by doing this. If it's an image that gets loaded often, like the hero image on your home page, small savings can add up over time. It is pretty easy to export both versions of the image and compare them to see if the file size difference is worth it.
Vector Files
For icons and other vector elements, you should go with .svg (Scalable Vector Graphics) - since it's a vector format it scales without any loss of quality so you don't have to worry much about resolutions, and it tends to be quite small in file size.
Be Warry of GIFs and Videos
When it comes to animated images, most people think of GIFs, but they aren't very good for your website performance as they tend to be large in size, so they will slow down the page and use a lot of bandwidth. To illustrate with an example, with the Webflow CMS plan you currently get 50 GB of bandwidth per month, which means you can load a 5 MB GIF 10,000 times, or a 50 MB GIF just 1000 times before using up all that bandwidth on just that one resource.
This doesn't mean you can't have animated images on your website, you just need to use more modern formats that are smaller one size. One great option are Lottie animations which are natively supported in Webflow, and WebP and AVIF also support animation, although Webflow didn't support animated AVIFs last time I checked.
If you really need to use a GIF, it might be smart to host it somewhere else so you don't go through your bandwidth as quick. Same goes for videos, you want to host them on a video platform like YouTube, Vimeo or Wistia, and just embed it on your page - this way the video won't count towards the bandwidth limit.
Efficient Loading
Another aspect aside from file size is the loading property you set on an image. You can set it to eager, so it loads with the page, or to lazy, so it loads as the user scrolls to where the image is. In general, you want to use eager on images that are above the fold, and leave all the other ones as lazy - having all images load eagerly will slow down the page and consume more bandwidth.
Adding Custom Fonts
Another relatively large resources are fonts, but with them it isn't just about loading speed. You have a wide selection of fonts available to you in Webflow right from the get go, but most of these font are loaded from Google Fonts and you don't have much control over them. Additionally, loading your fonts directly from Google Fonts might violate GDPR rules.*
For these reasons, it is often much better to download those same fonts and upload them to Webflow as custom fonts - it's a few extra steps, but you only have to do them once and you will gain more control of how your fonts are loaded, which should help you improve performance.
When you download a font you will often be presented with multiple formats, and you want to go with one that is best optimized for the web. This will usually be .woff2, which will be smallest in size and it is supported by most browsers, but it's not supported by Internet Explorer so if you know that a lot of your visitors open your website on very old systems you might want to go with .woff to instead. If you need help with this decision look at your analytics, they usually show which browsers your visitors are using.
Once you have your font file, in Webflow you need to go to Site settings, and then Fonts where you will find a section called Custom fonts. Here you can upload all the fonts you need for your website. Make sure to name them properly and choose swap for the font display property. Once you have done this, you will be able to use these fonts in Webflow.
Further Optimizing with Variable Fonts
Another way you can optimize your font loading is by using variable fonts. If you are using several weights of one font, like light, regular, semi-bold, bold and so on, you will need to load several different font files, one for each weight. However, provided the font you are using is available as a variable font, you can upload just one file that contains all the weights of the font. This reduces the number of request that need to be made at page load, and it also give you control of all the variable properties the font has, unlocking more design opportunities.
Keep in mind that a variable font file will tend to be larger than any single font weight, which makes sense because it contains all of them, so if you know for certain that your website will only use one or two weight of that font it might makes sense to keep using static fonts. You can easily look at file sizes and do the math, but if static fonts are only slightly smaller, I would go with variable as the browser will only need to make one request, plus it is easier to preload it (something we will cover later in the article).
Efficiently Loading External Scripts
Third category of resources that will be loading on a page are scripts. Most businesses a have a lot of tracking and analytics on their websites, like Google Analytics, Facebook Pixel, TikTok pixel and so on. On top of that you might have scripts that expand your websites functionality, and all these scripts can add up in size and slow down your website.
The solution is to delay the loading of some these scripts by adding attributes like async or defer attribute to the script element. Both will ensure the script gets downloaded in the background, so that the download itself doesn't pause HTML parsing. With async, the script will be executed as soon as it's downloaded, pausing parsing, while with defer the script will be executed once HTML parsing is complete. Async scripts might get executed a bit sooner, but unlike defer, async doesn't guarantee the order in which they will be executed so it shouldn't be used if there are any dependencies between them. For most scripts, using defer will the way to go.
You should also take a look at all the scripts on your website and think about if you can completely remove some of them. Also, consider a script needs to be loaded on all pages or just some of them - for example, you likely want to load analytics across the website, but if you have something like a script that help you integrate Webflow forms with another tool, you should only load that script on pages where you have forms.
Another, somewhat unexpected way you can improve script loading is with a cookie consent form. Because the user needs to accept cookies first, the consent form will keep some scripts from loading right away, which can help improve performance for first-time visitors. On concurrent visits the scripts will load (if they accepted cookies), but some resources will already be cached from the first visit so the loading speed should still be good. However, this can depend on how the consent form was made.
Optimizing Largest Contentful Paint (LCP)
Largest Contentful Paint measures the load time of an element above the fold that is biggest in size AND has some meaningful content, so it will usually be a piece of text or an image - a big empty div doesn't count as a contentful element.
In order to optimize it, you first need to know what elements is the LCP and speed test tools we discussed will give you this info - in PageSpeed it will be under Performance, even if there are no issues with it. Note that LCP may be different between Mobile and Desktop.
Once you know what element is the LCP, you can decide on your course of action. For example, on a blog post page you might decide to make the title bigger and move it above the cover image so that it becomes the LCP. Text tends to show up faster than images as they take some extra time to load, so this could be a way to improve LCP a bit, just don't force it and don't ruin the page's design and user experience just to have a different element be the LCP.
If the LCP is an image, applying all the image optimization practices we discussed will help - make sure it is properly sized and that it's set to load eagerly. One more thing you can do is add fetchpriority="high" under custom attributes to prioritize the loading of this image. Avoid adding this attribute to images below the fold because you will just slow down the loading of other critical elements and use up more of your bandwidth, plus there is no need to load these images right away so there are zero upsides to having it on all images on the page.
Another thing that could lead to a slow is LCP is a TTFB that is too long - we will cover this when we talk about redirects in just a bit.
Optimizing Cumulative Layout Shift (CLS)
Cumulative Layout Shift measures visual stability and unexpected layout changes on your page. It is one of the Core Web Vitals because big shifts can layout can have large negative effects on the user experience - a user might try to click a button but they might miss it because an image above it just finished loading and pushed it down, so they might end up clicking on a different button that takes them to a page the didn't intend to visit.
There are different factors that can cause layout shifts, but two factors I come across most often are images without a specified width and height, and font swaps, or in other words, your custom font replacing the default one once it's done loading.
Image width and height
To address the first issue you simply need to add width and height to the image, and here we are talking about the width and height fields in the Settings tab, not CSS width and height properties you can add in the Style tab. The numbers you add in Settings become part of the HTML so unlike the CSS properties, which may take some time to load, they go into effect right as the browser is parsing the HTML file. This helps the browser know how much space to reserve for the image so it doesn't have to shift the layout later on when CSS finishes loading.
Important thing here is that the width and height have to maintain the original aspect ratio of the image, so if you image is 120x80, you could use 120x80 or 60x40 as width and height, but using 50x50 will produce a different kind of error.
Font Swaps
When it comes to addressing font swaps, there are two things we can do here, choose a fallback font that is as similar as possible, and make your custom font load faster. You can address both of these in the Site settings.
For fallback fonts, the list of fonts you can choose is very short, so just try to find the closest one and go with that. This way, when the fallback font gets swapped for your custom one, the layout shift should be minimal.
Another thing you can do is try to load your font faster using the preload function. First step in doing this is to find the URL your font is hosted on by Webflow. You will have to publish the page (at least to stagging), inspect the code and find your fonts - they will most likely be in your CSS file which can be found under Sources. Once you found that you want to add it as href in this snippet shown below, and then go to Site settings > Custom code and paste the snippet into Head code. You might also need to adjust type if your font isn't .woff2.
<link rel="preload" href="*font URL*" as="font" type="font/woff2" crossorigin>You can see when you fonts start loading using the waterfall feature in WebPageTest, so make sure to run the test before and compare it with the after to verify your snippet is working properly.
Cleaning up 301 Redirects
In simple terms, Time to First Byte (TTFB) measures time between a request being made (a user clicking on a link to your website) and the first byte of the page's HTML starting to load. For this reason, your LCP can never be shorter than you TTFB, so if your TTFB is 2.5 seconds or more there is no way to have a good LCP, no matter how much you try to optimize it.
TTFB is affected by some things you usually can't control, like DNS lookup and server response time, but one big factor you usually can control are redirects. How much time a redirect adds to TTFB can vary, but in my testing it was usually around 0.7-0.8 seconds per redirect. Having some redirects is usually unavoidable but having redirect chains, where a URL redirects to a second URL that then redirects to a third URL and so on, is something you can control in most cases.

If a URL of a page keeps changing, and each time you just create a 301 redirect from the most recent URL to the new one, you will end up with a redirect chain. The user will get to the right page in the end, but it will take longer and it will negatively affect your TTFB and LCP, and the users will be more likely to abandon the page thus decreasing your conversion rate. The fix for this is very simple - in Webflow navigate to the Site setting for the website in question, and under Publishing you will find a section titled 301 redirects. Once you are there the goal is to make old URL point directly to the current URL, instead of pointing to another old URL. Note that you will likely need to delete some redirects before adding new ones to replace them.
If you change your domain
Once case where you might encounter a lot of redirects is if you change the domain your website is hosted on. For example, I did this for my website recently, so there are a lot of backlinks pointing to the old domain that need to get redirected to the new one, and that is why TTFB is a bit worse for my homepage than for the website as a whole.
If you are thinking about moving to the new domain, take a look at how much traffic you are getting from sources you won't be able to update. You will be able to change the URLs on your social media and in ad campaigns, Google will update it's search results over time, but backlinks you have on other people's websites and blogs will likely remain the same, unless you contact all of them and ask them to update the links.
If only a small portion of your traffic comes from this source, you have nothing to worry about, but if it's the other way around know that your TTFB might take a hit if you move to a new domain - it doesn't necessarily mean it will go into the red, but it will get worse.
Cleaning Up Your Code
Even though you don't have to write any code to make a website in Webflow, the tool does generate code and the finished websites runs on HTML, CSS and JS, just like pretty much any other website on the internet. How you use the tool can affect the code that gets generated, and if you don't follow best practices you can end up with code that is larger than needed.
Every class you add makes your CSS file bigger, and in Webflow you have one CSS file that gets loaded for all pages. Because of this you should strive to be consistent with your use of classes and clean up any unused styles as they also end up in your CSS file - you can use the "Clean up unused styles" function in the Styles panel to remove all of them at once.
Keep in mind that we are talking about code, so a couple extra classes don't add up to much, but if every heading and every section has their own class it can become an issue. This isn't just about performance, but about consistency and easier maintenance - if you want to update all H2s or all buttons, but they all have different classes, it will take a lot more time and there is a chance you might forget some of them.
Note that I wouldn't recommend this as the first area to focus on because it can take a lot of time and the performance difference might not be as big as with other optimization methods. However, I think this should definitely be done at some point, and you can at least clean up unused classes right away.
Maintaining Good Performance
Once you optimize your website, keeping it fast is just as important. How much you need to worry about your performance dropping will depend on how many changes you are making - if nothing is changing, you won't have to worry about performance at all, but if your website is changing a lot you should monitor it's performance closely.
Webflow has a powerful CMS and Editor / Edit mode roles that keep non-technical people from making big mistakes, so it's totally feasible to hand over the website to your marketing team who will just be adding blog posts and updating copy here and there, and not have to worry about performance. With proper website setup and a bit of documentation this can be done.
However, for most startups the website will keep changing, especially at early stages, and it will often require more than just blog posts and copy updates, so if you want to maintain top performance, you will want someone with technical knowledge to always be in the loop.
Let's take a deeper look at what you can do and how to address different scenarios.
Setting Guardrails
If your non-technical team members will only be using Webflow to add CMS items like blog posts and testimonials, you can prevent a lot of issues by implementing different guardrails.
For example, for CMS image fields, Webflow allows you to set minimum and maximum width, heigh and file size, which should prevent people from uploading images that are too big and slow to load, or too small and blurry on larger screens.
However, this kind of limitation can't be put on static images across the website, nor on the image within rich-text fields, like the ones used for blog posts. This is why guardrails can't be your only step towards maintaining performance.
Creating Documentation
Documentation can pick up where guardrails left off, you just need to take the time to create it and then make sure everyone relevant reads it. If you decide to create this documentation, you should focus on explaining things that are most likely to degrade performance if done improperly - most often these will be images, scripts and redirects.
Take a look at your website and try to anticipate what things might cause issues. Try to also document things that can't affect performance, but might give your teammates a headache - for example if you have a promotional banner at the top of the page that you hide when there is no active sale, document how to make it show up, update the text and hide it again once the sale ends.
For things that aren't specific to your website, but have to do with how Webflow is used in general, you can point them directly to Webflow's official help center. You can also include links to this throughout your own documentation.
When it comes to CMS items, you also have an option to add help text for each one, that will appear right above the field so anyone using it can't miss it. You can use this feature to explain how a certain field will be used, for example where a specific image will appear. You can also add other info, like what image format should be used.
Link to The Status Page
Since I've started using Webflow, I never had a client who managed to crash their website, but I did have one occasion where a client thought they did. They were making some changes to the blog and the moment they hit Publish happened to coincide with an outage that affected a lot of other Webflow websites as well. This is definitely an edge case, but addressing it is very quick so I think you should do it - you just need to include a link to Webflow's status page in your documentation.
Hiring Help
The previous two steps are good to have but you could skip them all together if all the changes on your website are handled by someone experienced with Webflow. However, this can't always be the case and you will very likely need your marketing team to also be working on the website, so a more realistic solution would be to have someone experienced to handle bigger changes and clean up any mistakes others might make.
Your inclination might be to look for a junior Webflow developer, but for this job you really want someone with more experience. The good news is that this likely won't require full-time work, so you can afford to hire someone experienced for 10-20 hours a week. Depending on how many changes you plan to make on your website, you can even do more or less hours than this. Freelancers will be your best friends here as you will have more flexibility than with regular employees.
If the nature of your business is such that your website barely needs to change, you likely won't need to have someone on payroll at all - if the website was optimized properly from the start you shouldn't have any issues, and if it wasn't, hiring someone for a one time optimization project should do the trick.
Conclusion
I sincerely hope that this article demystified website optimization for you and that you understand how important it can be for your business. In this article we focused on Webflow, but most of these tactics to apply to other types of website as well, you just implement them differently.
If you have any questions or ideas about topics you would like to see me cover, feel free to reach out to me at hello@ljubomir.design.
* This article shouldn't be treated as legal advice. If you require help with Google Fonts and GDPR, make sure to consult a lawyer.
Author
